Reflection #5

What do we use when we want to show data on geographical space? “The map, that’s right!” Dora once said. This week is all about mapping software, specifically ArcGIS.

ArcGIS supports many different file type imports but the .csv is the one we’ll use. To me, csv files look like spreadsheets but not limited to a particular software like excel. The dataset I’ll be testing with is the Iowa Townships Data Codebook which I think will show the geographical location of homes in town when visualised on a map. In particular I’m curious to map the different occupations of the head of household. (I already expect to run into issues because I can see that the same job has different ways of being written in the file.)

After creating my first map in ArcGIS the different basemaps remind me of something. In my ancient Greek history class we have frequent map quizzes. The map I used to study on is a “Light Grey Canvas” as ArcGIS calls it, but the map on the quizzes are usually topological. Sure all the geographical elements are there but on the topological maps the mountains and cliffs (Greece is very mountainous) stand out spectacularly while on my study map they are just triangle lines to indicate mountains. I remember thinking “Where is that river valley?” because on the topological map it was overshadowed by the tall mountains.

The different visualisations create different effects like the ones that change size and colour based on how large a number is has greater visual impact but can obscure detail. You can significantly change the perception of a dataset with the visualisation, I mean even using red for one field and blue for another can affect perception that the red ones are more impactful. The large size can also make the other data from the larger points seem more important when that is only one data field and not necessarily related to other fields.

The pop-ups also influence the viewing experience because it can give data beyond what is mapped. Sometimes the pop-ups can show important data like the family’s names can’t be easily mapped because you would end up with hundreds of different categories. In the pop-ups there can also be written context for each point on a map that would be too long to show by default. I wish the pop-ups could be hover to show rather than click to show because the UI makes it unclear that you can click each point.

Accessibility when making a visualisation in ArcGIS is also important. Map creators should remember to choose a basemap that compliments their data, for example don’t choose the navigation basemap if you are mapping something related to the geography of the location. The creator should also remember the basics of making the data points a colour that stands out from the basemap (ArcGIS has blessed blend modes which makes this much easier for the same point colour on different map colors!). Ideally the colours should be colour-blind friendly (the most common is red-green colour blindness) and have appropriate contrast from other data point colours.

I feel very confident in helping someone figure out ArcGIS because the UI is pretty intuitive to me. I do with they had hover tooltips but I can figure out specific functions or code expressions with their documentation and google. One final thing I must remember to tell people is ArcGIS does NOT autosave.
Reflection #4

This week is the we learn the red golden ratio tool.

Learning Omeka felt very intuitive for me probably because of it’s age (first released in 2008). I feel very confident in being able to help others learn the basics of Omeka from the tool itself to exhibit and item organisation. Also I’m able to help with translating from their metadata fields to Dublin core standards or adding new fields because I ran into a similar issue before. However if someone wanted to do a very specific thing with Omeka I may or may not be able to help.

My favourite thing has to be short codes, because they make me nostalgic. They are so convenient and space efficient when there’s a lot of items mixed with text. A lot of old net tools have them but newer ones don’t. (Or they do but hide the code aspect and immediately embed the item.)

I think it’s very interesting that image file names are the alt text rather than having a separate alt text field. Omeka showing its age I guess. I wonder if the alt text shows up as “image_name.png” too.

I don’t have a specific use case for Omeka at the moment but if I did I’d want to test the limits of it. What kind of non-library archives can it hold? How creative can the exhibit and item displays be? (May I wield the power of iFrames?)

Reflection #3

Ah, Excel my beloved, all thanks to physics.

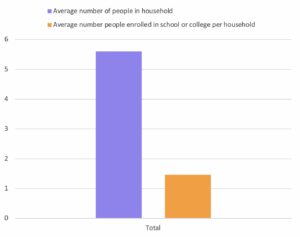
I made a bar graph of average number of people in a household & average number of people enrolled in education. I tried other visualisations but the 1870s census data isn’t set up for a lot of the available representations.

Excel chart showing average number of people in household and average number of people enrolled in school of college per household

With PivotCharts (and more so PivotTables) you can make bar graphs to pie charts, scatter plots to waterfall charts. The visualisations could really impact understanding. While I was making the chart I realise I can change the scaling of the y-axis, if I made the y-axis a scale from 0-20 the ~4 people difference in the data wouldn’t seem as great compared to how the data is presented now. This TED talk talks more in depth about how the display of data can skew its perception.

I chose to graph these 2 data points in this way because it was interesting how few people per household were enrolled in education. I presented it in this way because it was the most clear to me. I could’ve put it as a stacked bar graph as well but that feels misleading because those are more suited for when you want to show multiple data values across a 3rd variable. For example, if there was the same data for the proceeding years, presenting the data as a stacked bar graph of the recorded values with the x-axis being years would make more sense.

Reflection #2

So this week is all about web accessibility.

After reading WCAG 2.1 AA Checklist and running this site through the WAVE AIM accessibility checker I’ve come some interesting conclusions:

  • the checklist made me realise if the appearance of elements other than images conveys meaning i should label it for screen readers
  • the WAVE checker made me realise the mobile / small screen optimisation of this site is HORRIBLE… like oh no
  • a technical feature that can help accessibility is a tool in website editors that lets them easily embed video players and audio players (full players, not auto-play) and add subtitles and alt text.
  • broader, I wonder just how the strictness of the checklist could affect the creativity and diversity of sites on the web. I come from the indie-web and many of the sites have terrible accessibility for sure but the experiences are very unique. I would not want a web that is all unified to a same layout. I think for big companies, government and educational applications and sites the accessibility checklist should absolutely be followed. For a carrd or heyspace by an individual it is up to them what they do.
  • another thing is the wordpress editor is not very accessible (to both those with and without assistive software). Why should professional web creation tools be inaccessible?
  • the checklist also didn’t mention an important part of UX which is the mental map of the site within the user’s mind. The best way I can put it is, can the user clearly envision  a “house” of “rooms” that are the szites that they can visit? Many pages may be accessibility compliant but the overall site navigation could be horrible and from experience that makes it visiting the site very frustrating.
  • something I didn’t consider until just now from experience is common browser keyboard shortcuts be kept to keep sites navigable. For example, on mac do not disable cmd + opt + left arrow and cmd + opt + right arrow because those are used to navigate between tabs. Another would be

After watching the Web Accessibility Perspectives Videos I realise these are the basics of web accessibility I already knew. I think the customisable text option is interesting because many times adding that to current websites with more elements would break the site’s formatting so web devs should make an effort to make things readable from the start.

I think the checklist is overly rigid and technical. The Manual Accessibility Testing from Harvard is a much better way to actually test a site.

This site is currently not fully accessible but that’s because I have a plan for the layout that I haven’t learned how to do yet. I want to add alternative text for my navigation buttons, change up the margins and edit the css.

Reflection #1

Okay! First reflection on the job, let’s go.

It’s a little scary right now having to learn everything for the job on the job, compared to the returning vivellows who have done the training already. It’s less of a fear of learning on the fly and more a fear of “what if I can’t answer someone’s question during a session???”, ie. disappointing someone else. I think I will get the hang of things before my trail by fire — a mentee during a drop-in shift— happens. I just need to remind myself that if I don’t know something I should admit that to the mentee and ask someone for help. It will make things a lot better than if I barrel on trying to wing it.