Ah, Excel my beloved, all thanks to physics.
I made a bar graph of average number of people in a household & average number of people enrolled in education. I tried other visualisations but the 1870s census data isn’t set up for a lot of the available representations.
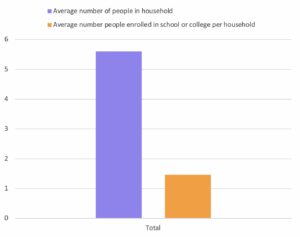
With PivotCharts (and more so PivotTables) you can make bar graphs to pie charts, scatter plots to waterfall charts. The visualisations could really impact understanding. While I was making the chart I realise I can change the scaling of the y-axis, if I made the y-axis a scale from 0-20 the ~4 people difference in the data wouldn’t seem as great compared to how the data is presented now. This TED talk talks more in depth about how the display of data can skew its perception.
I chose to graph these 2 data points in this way because it was interesting how few people per household were enrolled in education. I presented it in this way because it was the most clear to me. I could’ve put it as a stacked bar graph as well but that feels misleading because those are more suited for when you want to show multiple data values across a 3rd variable. For example, if there was the same data for the proceeding years, presenting the data as a stacked bar graph of the recorded values with the x-axis being years would make more sense.